
B2B marketing often requires that dense and complicated concepts be conveyed in a clear, concise manner. Using visual elements can reinforce and simplify the messages you’re communicating in writing.
At the Content Bureau, we’re often called on to take gnarly technical concepts and turn them into elegantly designed infographics. Through our work, we’ve found the following three general applications often make for high-impact, high-value infographics:
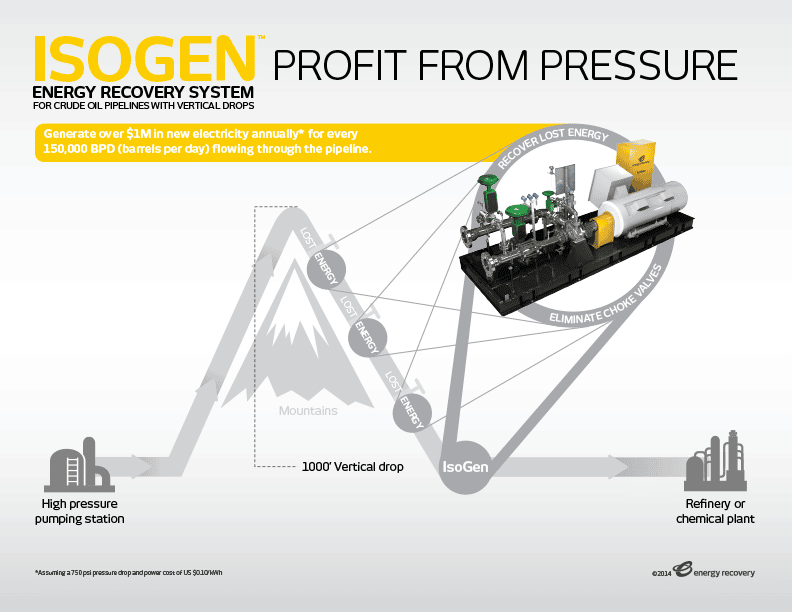
To explain a process
Consider using an infographic to explain a complicated process that your company helps to simplify. Here’s an example:
To summarize a large amount of content
Any set of principles or steps can serve as the foundation for an infographic. Think: five ways to generate higher revenues or seven steps to better customer relations.
We recently boiled down a 20-page white paper on the “five steps to better assessments” into this simple, one-page infographic with about 150 words:
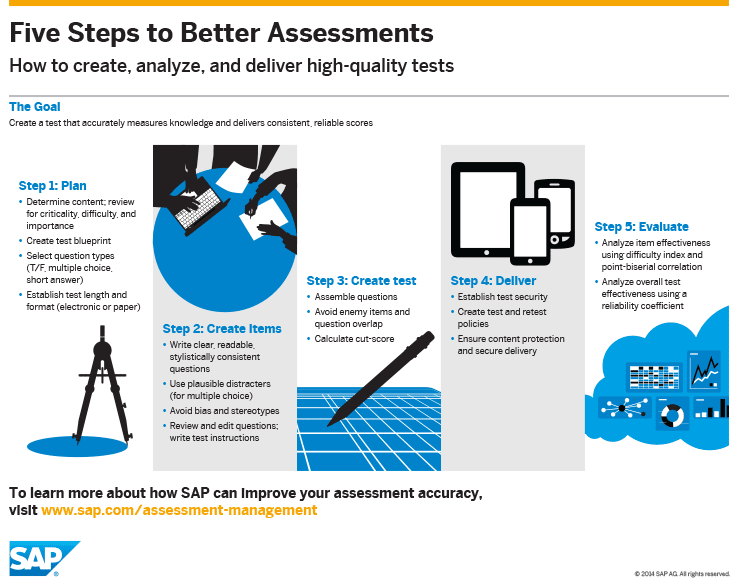
The infographic provides a high-level overview of the paper and directs the reader toward the full white paper for more information.
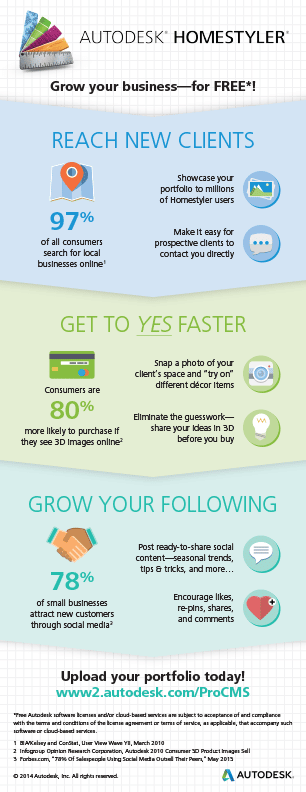
To share statistics
Statistics form the basis of traditional infographics. When you Google “infographics,” the results will most likely include an array of statistically based marketing assets.
Visuals turn otherwise dry data into eye-catching charts, tables, and interesting icons. And you can get creative in your visual representation: for instance, shading three-quarters of a relevant icon to show that CRM solutions boost revenues by 75 percent, on average.
To add credibility to any story or B2B marketing messaging, include statistics tied to research the reader can easily reference—as we did in this example:
What does it take to create high-impact infographics that distill complex content into one visually interesting and deceptively simple visual? To do it well, you need a mastery of the content as well as keen design skills. Good design begins by determining what content is ripe for an infographic, and then identifying the best format for presenting that information.
Whether you need to make a large amount of data digestible, illustrate a multistep process, or vivify dry statistics, B2B infographics can be a highly effective medium for your B2B marketing messages.
Our infographics experts at the Content Bureau can help you identify great content for an infographic and create a compelling design that boldly tells your story. (If you want to know more about our services, check out our own infographics!)


